

You’ve got visitors flowing in, but they’re slipping through before making a purchase, signing up, or requesting a quote.
The disconnect almost feels personal, doesn’t it?
You put in a lot of time to optimize your copy, tweak your designs, and maybe even reduce your form fields from seven to three, but the gap between traffic and conversions just doesn’t seem to close.
What’s happening is that your visitors are taking unexpected detours, hitting roadblocks, or wandering off entirely. They aren’t following the paths you designed.
And the solution isn’t more traffic. You need to understand the customer journey and strategically remove friction points along their path.
Why Websites Leak Conversions (and How Journey Mapping Fixes It)
Generally, customers follow a simple path from not knowing your brand to becoming your customer:
- Awareness
- Interest
- Consideration
- Engagement
- Purchase
- Experience
- Advocacy
At each step down the funnel, you’ll have fewer customers than in the one before.
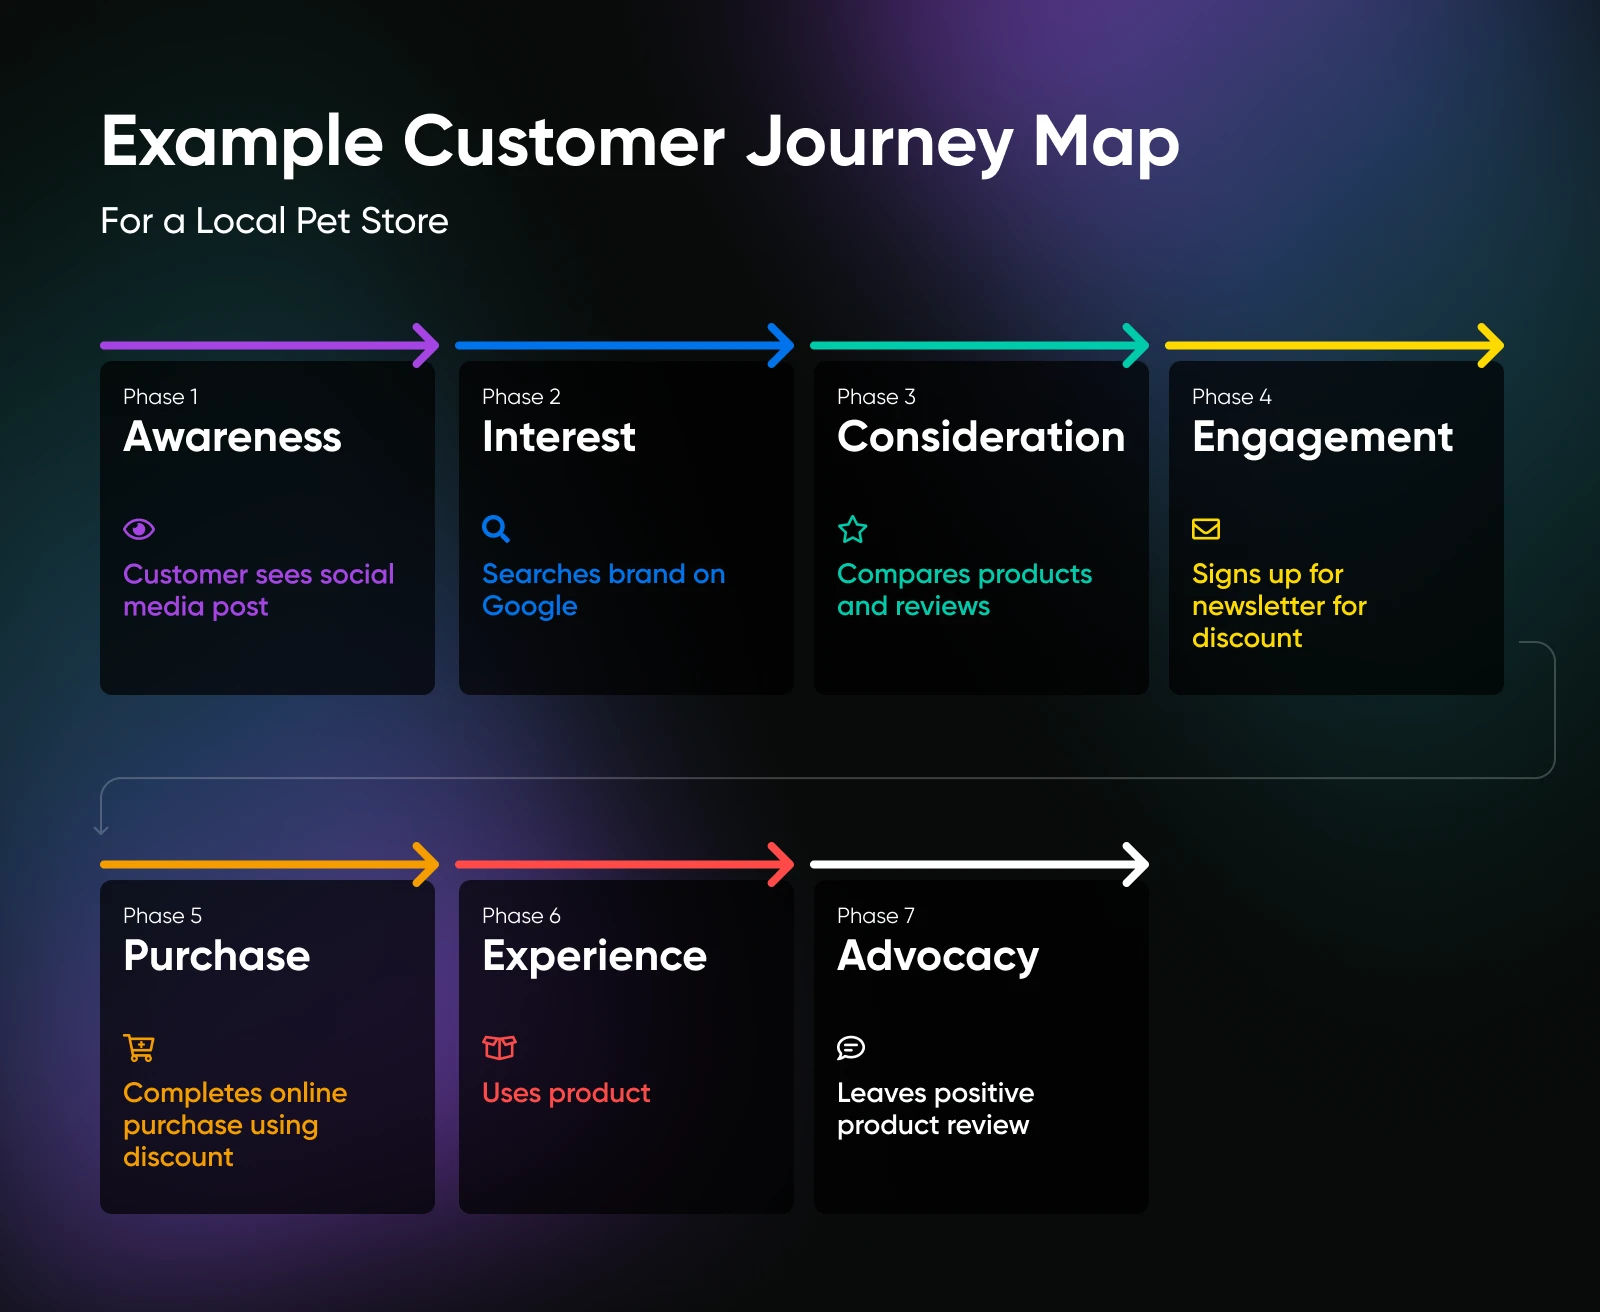
The points where customers drop off during the customer journey are called conversion leaks.
Now, customers can drop off because they don’t need the product, don’t have a problem, or never intended to make a purchase. We can’t be sure.
Our job is to treat every visitor as a customer and reduce friction across all points.
And the first step to fixing conversion leaks is to map their actual journey with an analytics tool like Google Analytics. You want to visualize the exact drop-off points so you can start acting on them.
Companies that implement customer journey management see remarkable results:
- 54% greater return on marketing investment
- 10x improvement in customer service costs
- 3.5x greater revenue from customer referrals
- 18x faster average sales cycle
- 56% more cross-sell and up-sell revenue
These are results from companies that stopped guessing and decided to take control of the customer journey.
Why Use Google Analytics 4 for Customer Journey Analysis?
GA4 represents a fundamental shift in how we track user behavior online. Unlike Universal Analytics (UA), which used a session-based model, GA4 uses an event-based model that tracks every single interaction.
What makes GA4 perfect for customer journey mapping?
- Everything is an event: From page views to button clicks to video plays, GA4 captures it all in a consistent format.
- Cross-device tracking: GA4 follows users across devices, giving you the full picture.
- AI-powered insights: GA4 spots patterns and anomalies humans might miss.
- Visualization tools: Built-in capabilities to see paths and funnels without spreadsheet gymnastics.
To make things simple, GA4’s interface organizes these capabilities into four main sections that work together to reveal your customer journey.
- Reports: Shows how users accessed your site, where they came from, and what they’re doing.
- Explore: Advanced interface for custom reporting and sophisticated visualizations.
- Advertising: Deeper insights into conversion performance across channels.
- Configure: Management tools for custom events and dimensions to track specific journey touchpoints.
These components work together to give you a comprehensive view of how users navigate your website.
Five Reports To Map Customer Journey in GA4 (and Actually Use It)
GA4 contains specific reports that uncover your customer journey and highlight conversion opportunities. Each serves a distinct purpose in understanding how visitors navigate your site.
1. Path Exploration: Mapping Real Customer Routes
Path exploration shows the sequence of pages users visit and actions they take on your website, revealing both successful paths and problematic detours.
Where to find it:
Sign in to your Google Analytics 4 property. Go to Explore > Path exploration.
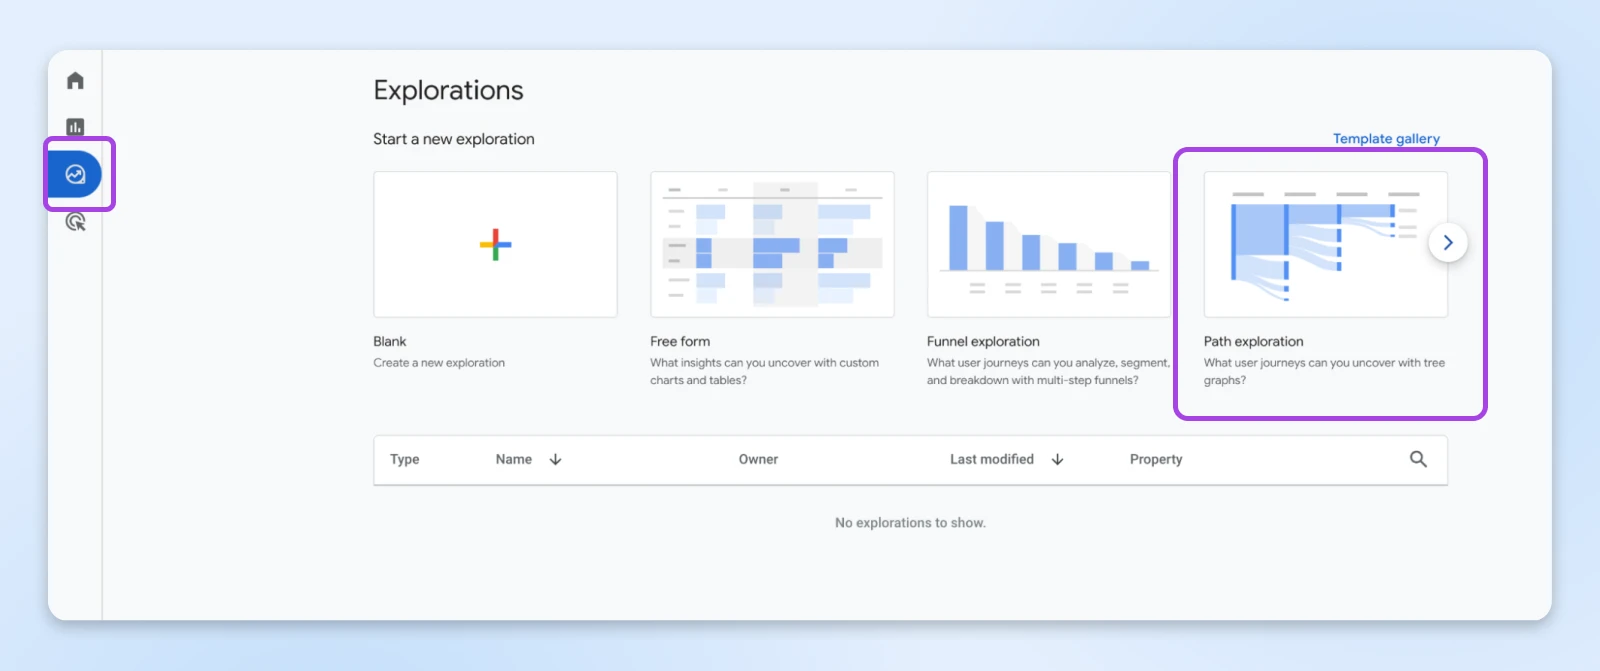
By default, you’ll see the default path going from session start to page view, and either a click, a first visit, or maybe a new session.
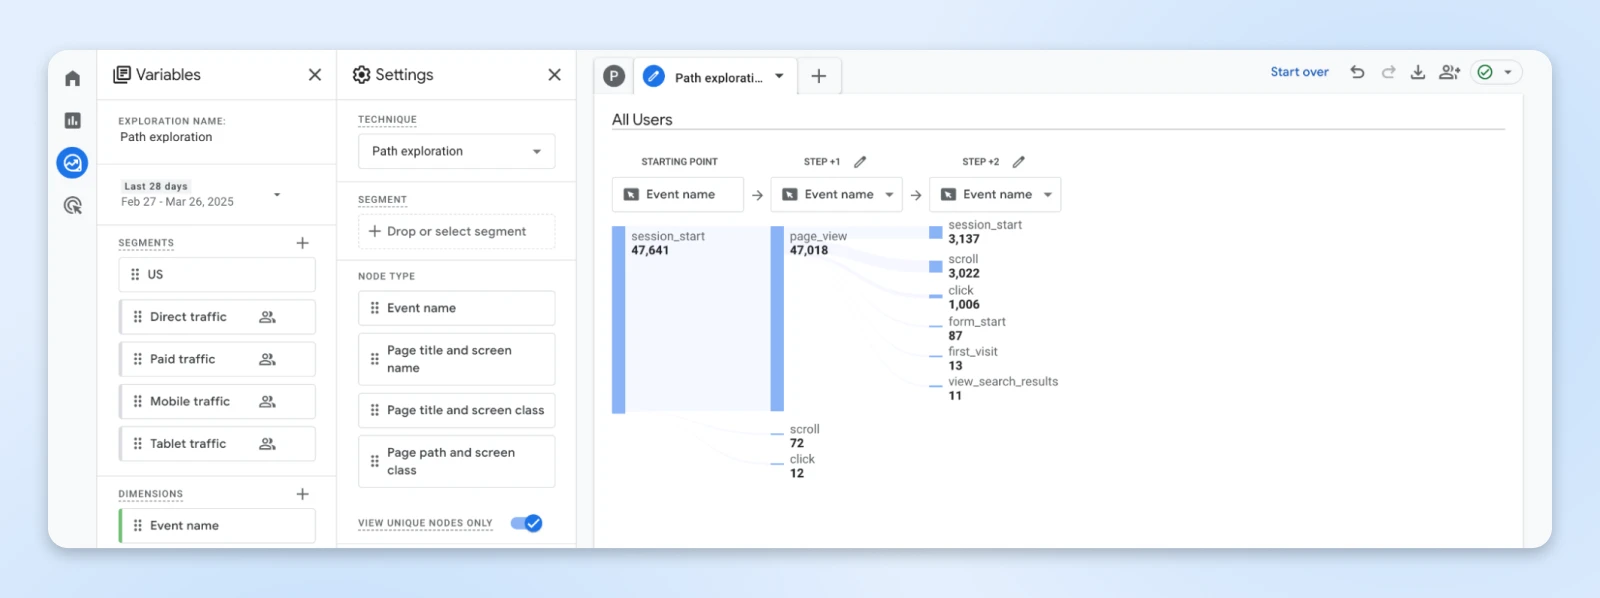
If you wish to check for a specific path from scratch, click the Start over link at the top right, and you’ll be able to build the path by adding a start and end event or page.
How to use it for conversion optimization:
There are two perspectives in path exploration.
1. Forward-moving analysis: Shows what happens after users visit a particular page or trigger an event.
- Start with your highest-traffic entry pages.
- Follow the paths to see where users go next.
- Identify where they drop off before reaching conversion points.
2. Backward-moving analysis: Reveals what led users to a specific page or action.
- Start with your conversion events (purchases, sign-ups, etc.).
- Trace backward to see the paths that led to successful conversions.
- Identify common patterns in successful journeys.
How to optimize conversions with this report:
- Add strategic CTAs on pages that frequently appear before abandonment.
- Simplify navigation between commonly connected pages in successful paths.
- Create shortcuts to conversion points from high-traffic pages.
- Remove or redesign pages with high exit rates in the middle of journeys.
“The actual ‘conversion paths’ report in GA4 differs from the path exploration report, but I tend to use the path exploration report to analyze conversion paths by page,“ – John Reinesch
This approach gives you more flexibility in understanding both successful and abandoned journeys.
2. Segment Exploration: Different Users, Different Journeys
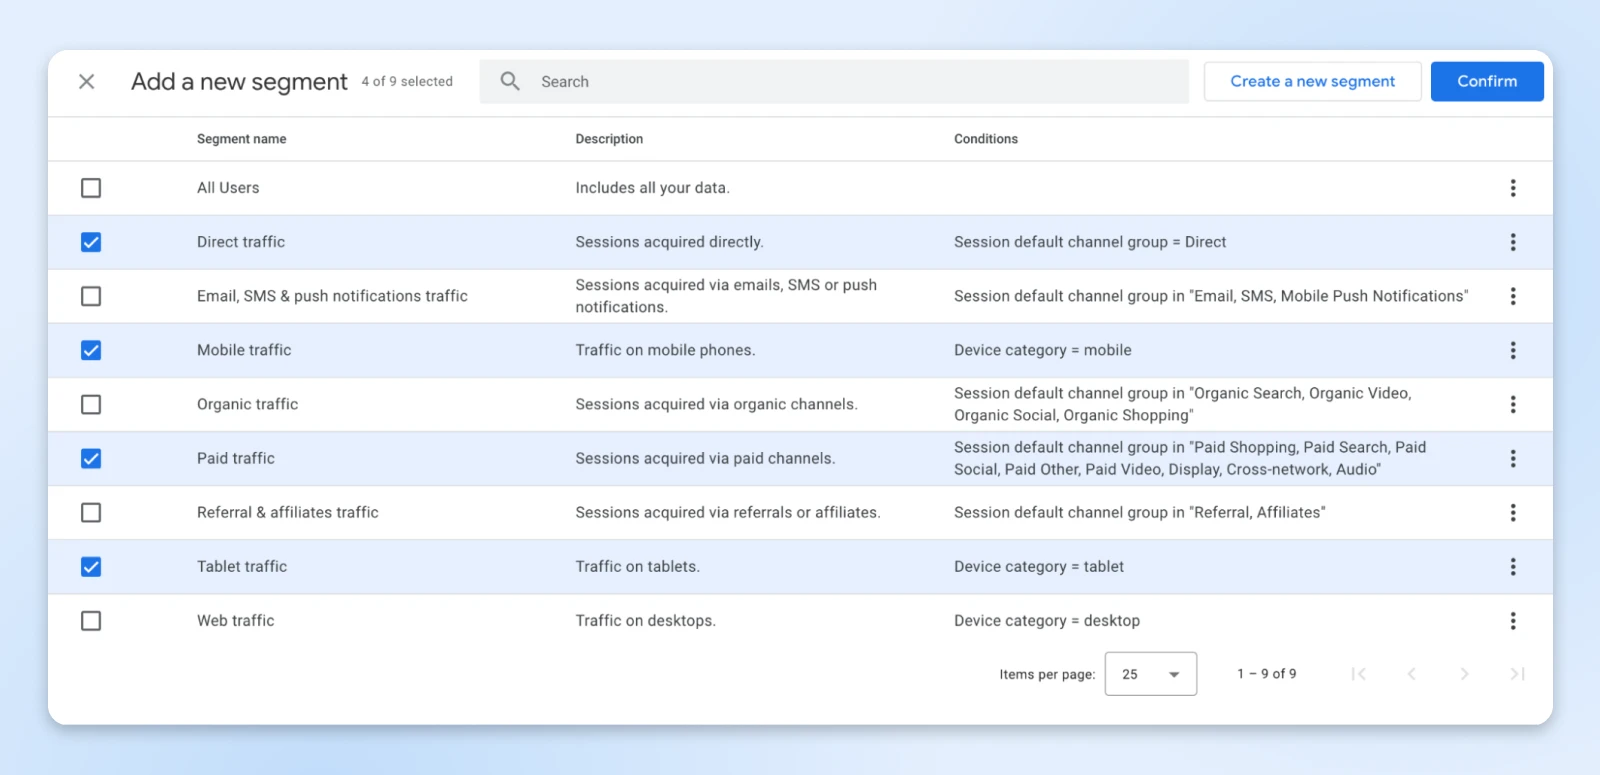
GA4 offers three types of segments that provide different perspectives on your customer journey, revealing how different user groups experience your site.
Where to find it:
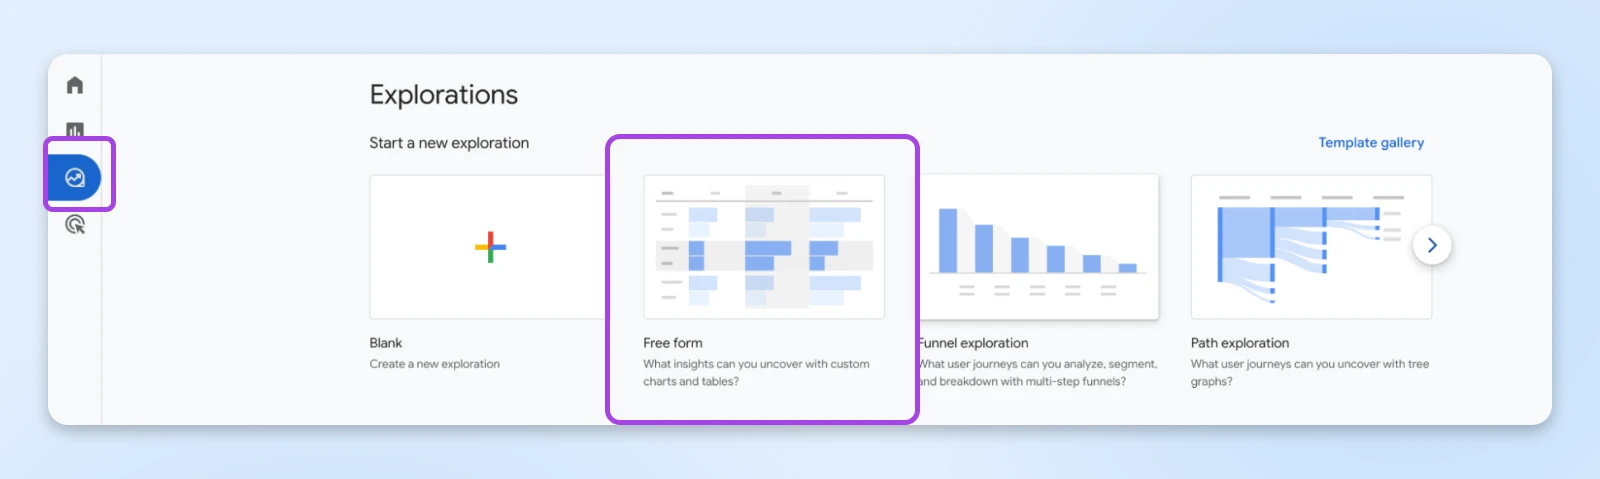
Go to Explore > Free form.
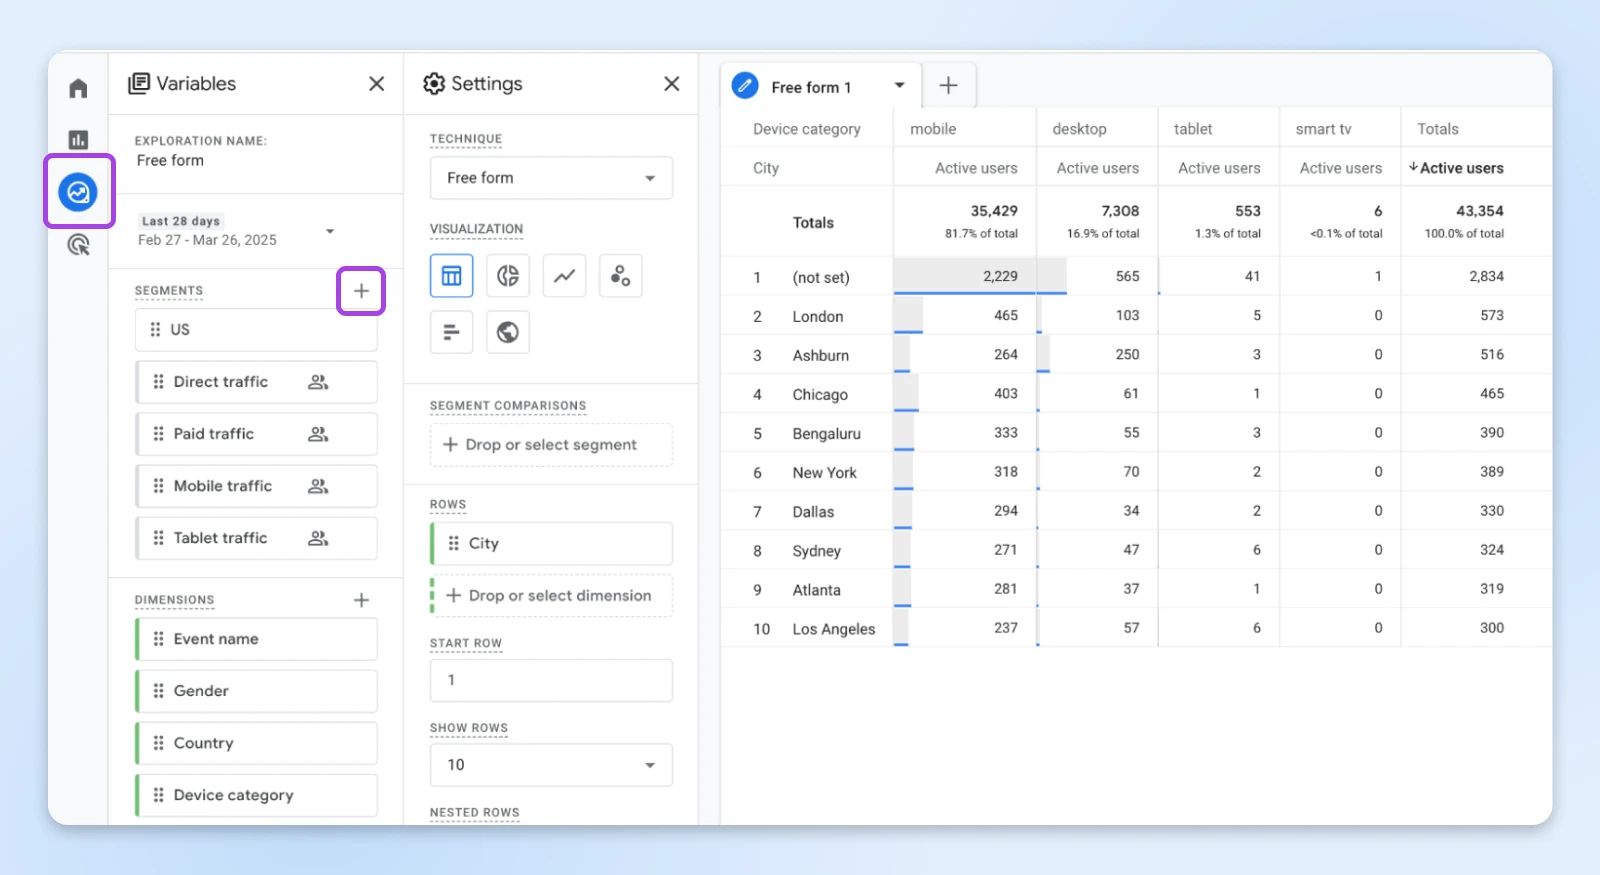
You’ll see a default free form report created. To add new columns or data points, find segments in the “Variable” column and click +.
How to use it for conversion optimization:
Start by creating high-value segments to compare journey patterns.
User segments: Include all events from users meeting specific criteria.
- High-value vs. low-value customers
- New vs. returning visitors
- Subscribers vs. non-subscribers
Session segments: Include events from sessions matching criteria.
- Direct vs. search vs. social media traffic
- Mobile vs. desktop sessions
- Different geographic regions
Event segments: Include only specific matching events.
- Cart abandonment events
- Search query events
- Video engagement events
How to optimize conversions with this report:
- Create targeted interventions for segments with lower conversion rates.
- Develop personalized content for different user segments based on their journey patterns.
- Allocate marketing resources to segments with higher conversion potential.
- Fix device-specific issues revealed through segment comparison.
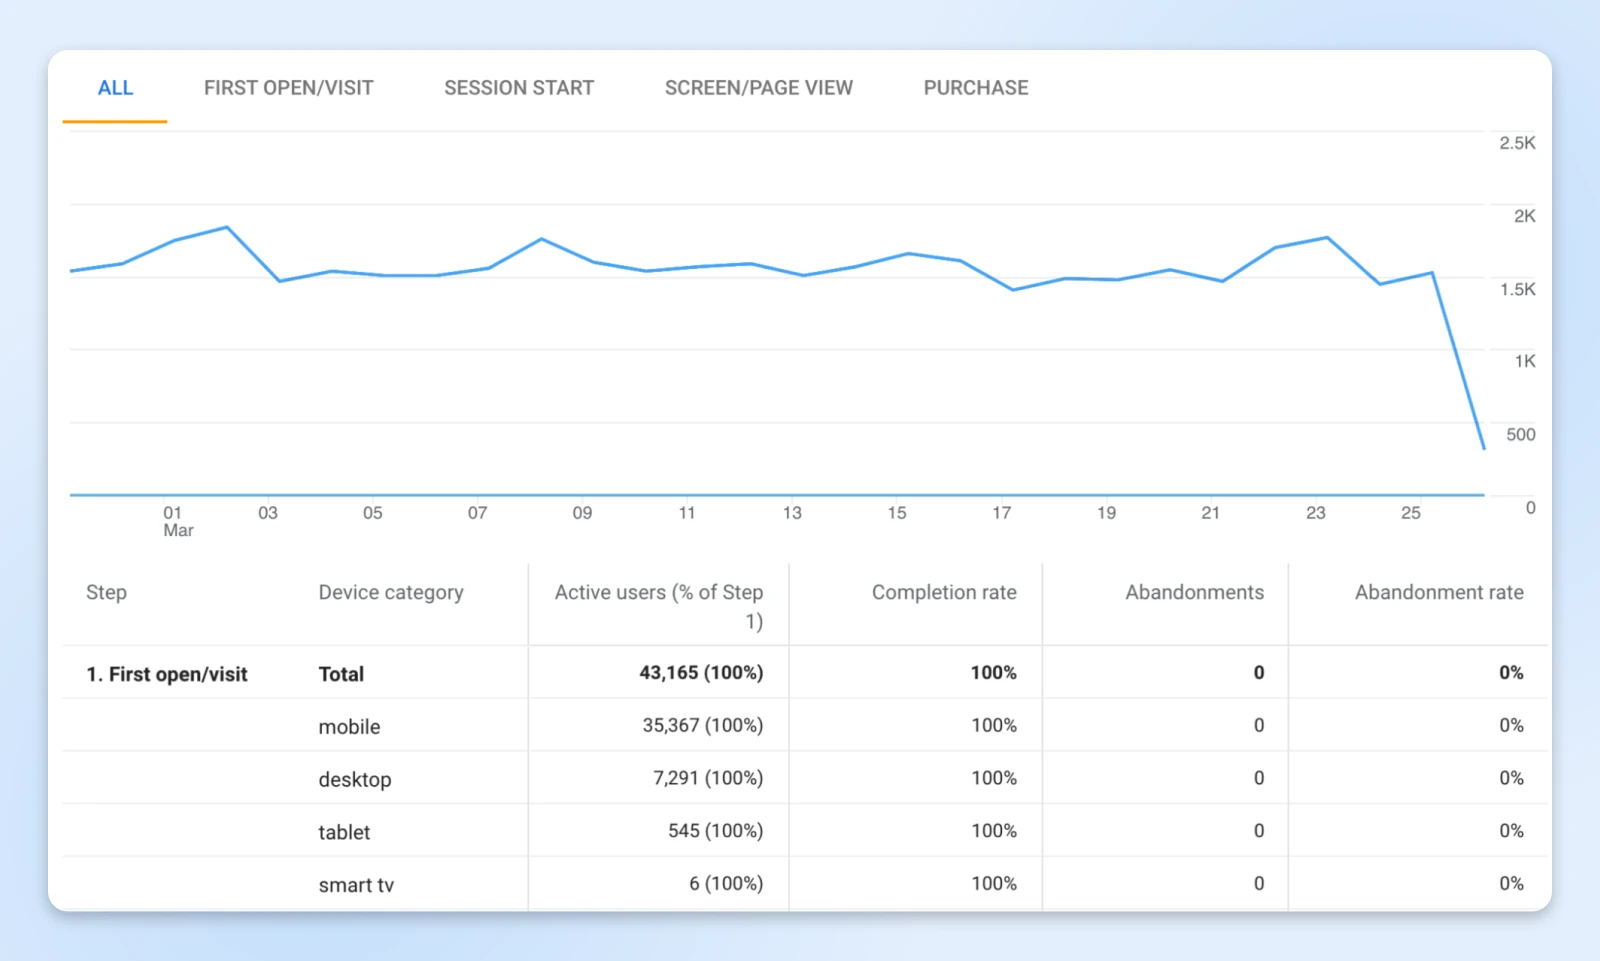
3. Funnel Exploration: Visualizing Conversion Pathways
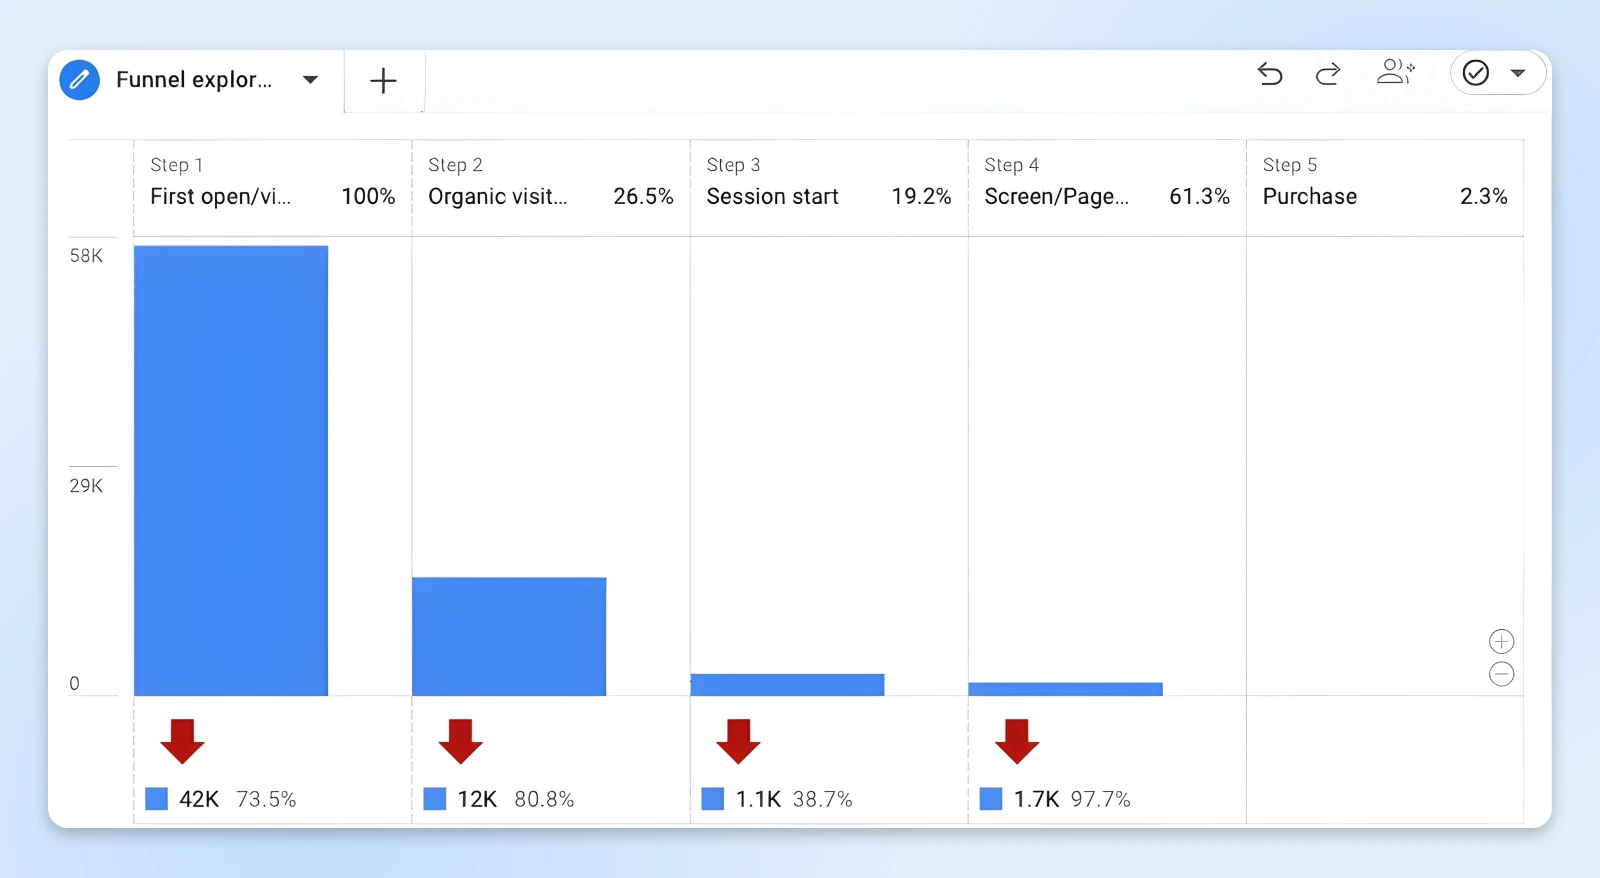
Funnel exploration in GA4 visualizes how users progress through your conversion paths and identifies exactly where they drop off.
Where to find it:
Navigate to Explore > Funnel exploration.
How to use it for conversion optimization:
GA4 offers two powerful funnel visualizations.
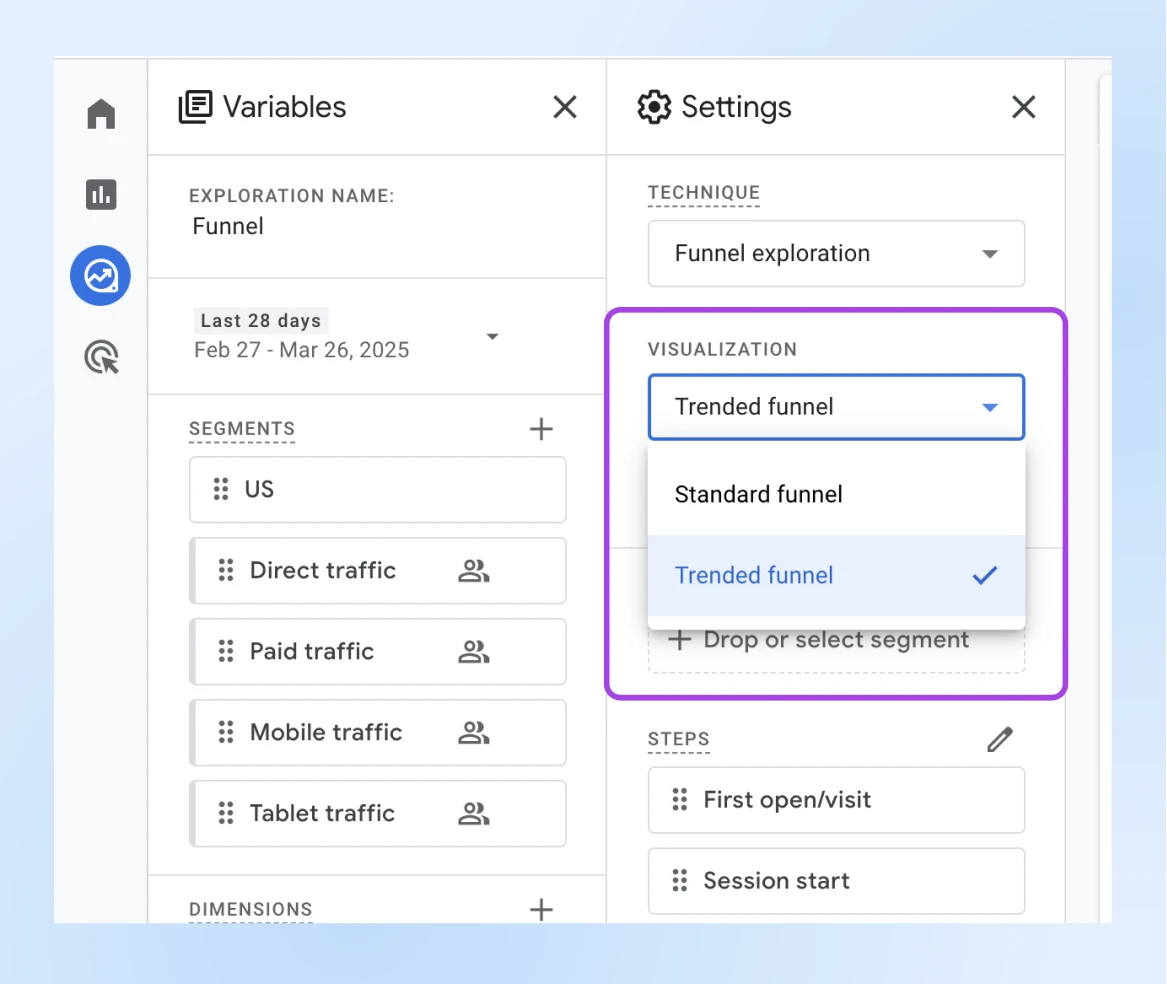
Standard funnel: Shows users at each step with conversion and drop-off rates.
- Create marketing funnels for your primary conversion paths.
- Compare current performance against previous periods.
- Apply segments to compare different user groups.
Trended funnel: Shows funnel performance over time.
- Identify seasonal patterns in conversion behavior.
- Measure the impact of website changes on funnel performance.
- Spot emerging problems before they become significant.
How to optimize conversions with this report:
- Start working on the steps (most likely a single page or set of pages) with the highest drop-off rates.
- Add incentives at common abandonment points to encourage customers to continue on the path.
- Create retargeting campaigns for users who abandon at specific funnel stages.
- Test alternative paths to conversion for different user segments.
Beyond identifying problems, funnel exploration helps you quantify the impact of fixing broken steps.
For example, if 1,000 users start your checkout process and only 250 complete it, improving that step by just 10% could yield 25 additional conversions.
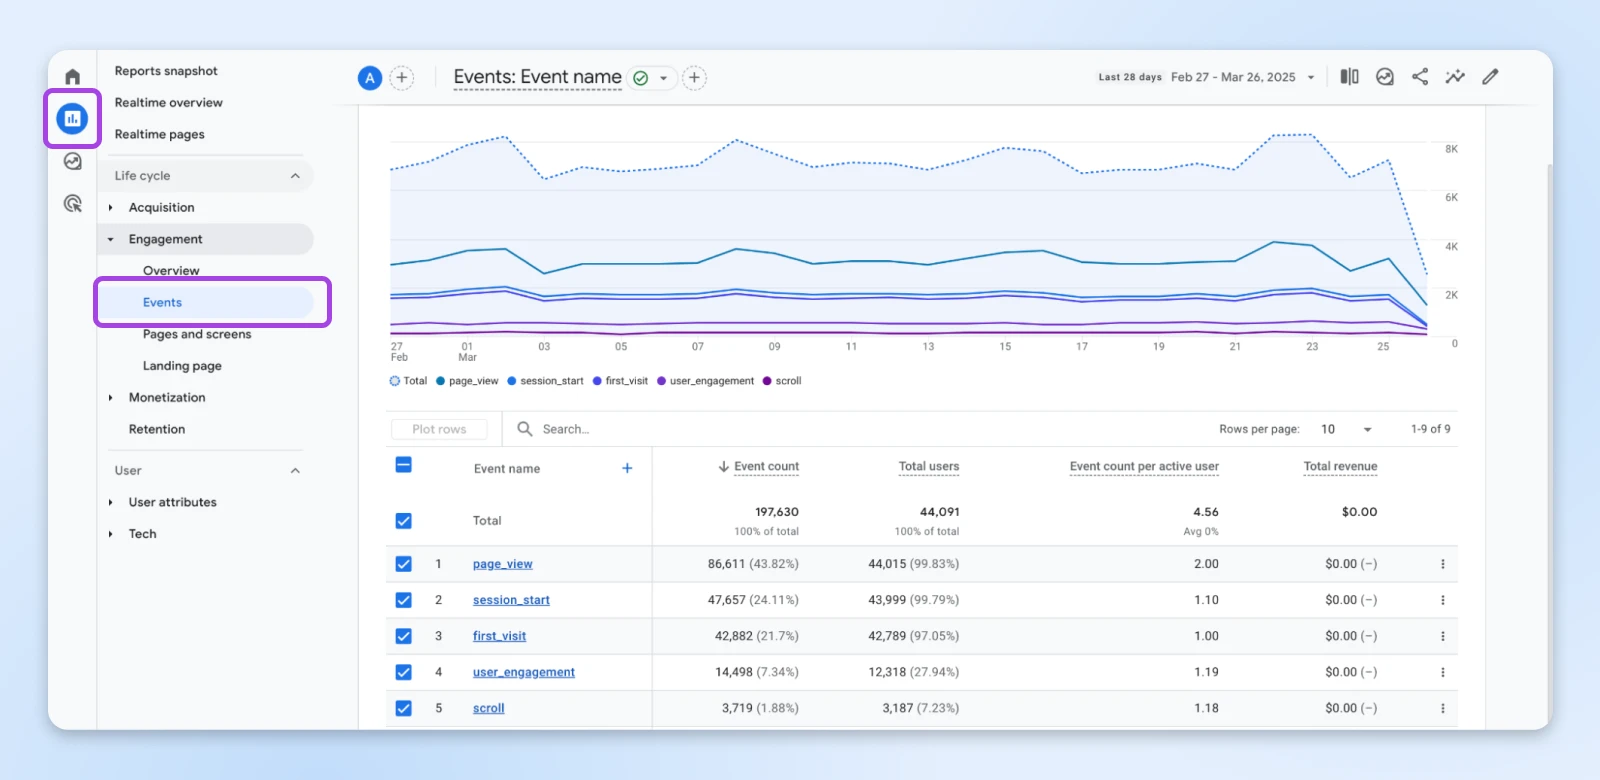
4. Events Report: Identifying Critical Journey Moments
Every customer journey contains critical touchpoints — moments where decisions are made that significantly impact conversion probability.
Where to find it:
For the “Events” report, go to Reports > Engagement > Events.
How to use it for conversion optimization:
Focus on these high-impact touchpoint metrics:
- Time to first engagement with key elements (product pages, pricing information)
- Engagement depth (number of interactions before conversion or abandonment)
- Conversion probability changes after specific interactions
- Return frequency to certain pages before conversion
How to optimize conversions with this report:
- Prioritize optimization of high-impact touchpoints identified in the analysis.
- Reduce friction at touchpoints with high abandonment rates.
- Add support resources at decision points with high return frequency.
- Create remarketing campaigns targeting users who engaged with critical touchpoints but didn’t convert.
Focus on high-impact stages. Look for the critical moments in your customer’s journey — the ones that pushed people away, and prioritize them. This targeted approach yields better results than trying to optimize everything at once.
To really dig deep on your customer’s journey, consider creating your own Free Form report with custom touchpoints using the tools in the Explore > Free Form report (as discussed in the previous section).
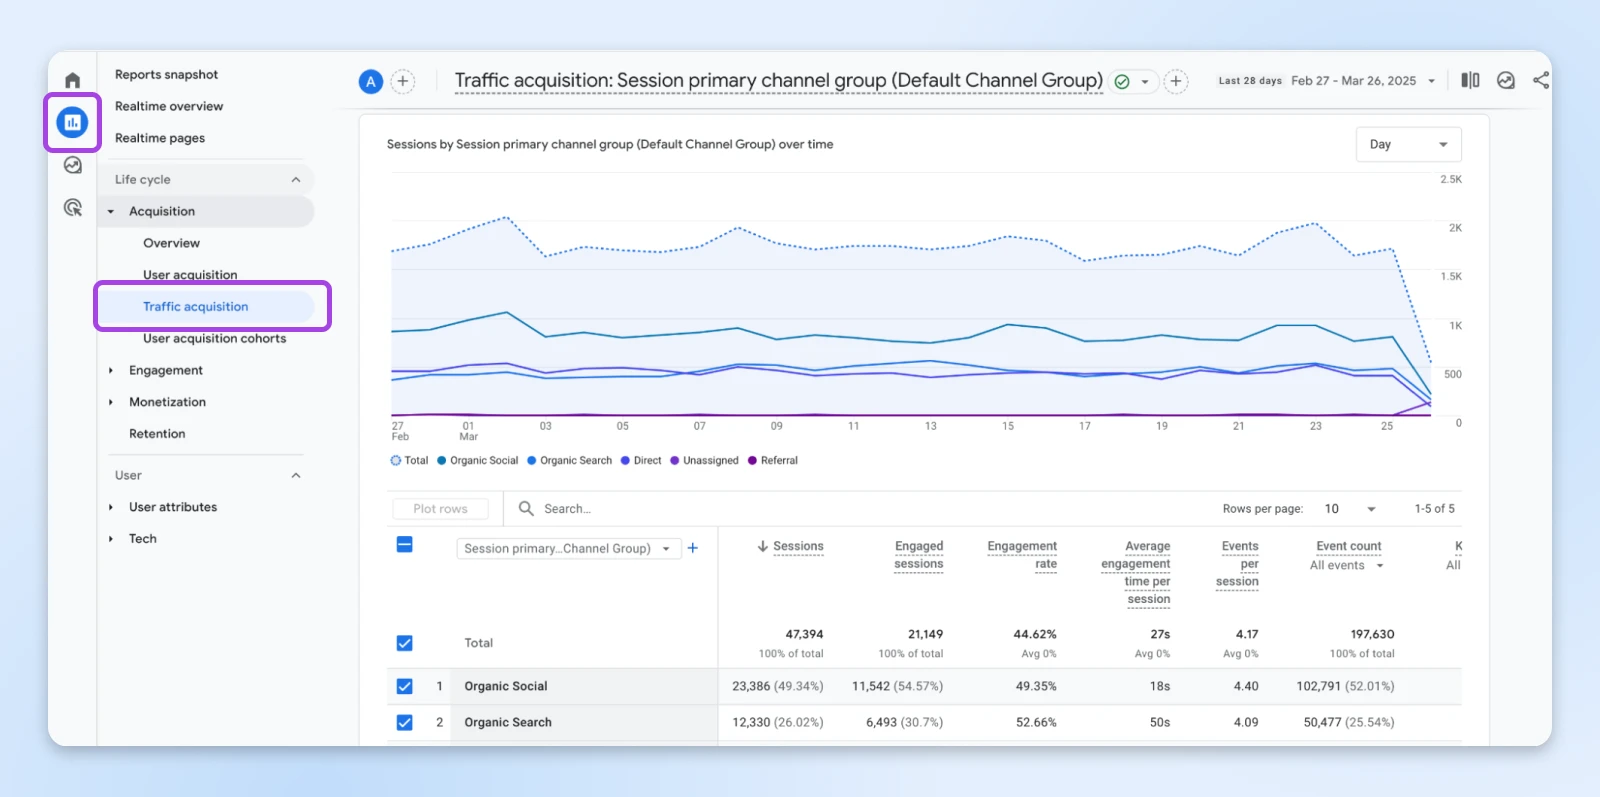
5. Acquisition Reports: Understanding Journey Entry Points
How users first arrive at your site significantly influences their entire journey and ultimate conversion probability.
Where to find it:
Go to Reports > Acquisition > Traffic acquisition.
How to use it for conversion optimization:
Analyze these entry point dimensions:
- Source/medium combinations with the highest and lowest conversion rates
- Landing page performance across different traffic sources
- Campaign performance in terms of not just traffic, but journey quality
- User engagement metrics segmented by acquisition source
How to optimize conversions with this report:
- Align landing pages with traffic source expectations.
- Invest more in acquisition channels that start high-quality journeys.
- Customize early journey steps based on the traffic source.
- Develop targeted onboarding for users from different channels.
Traffic sources that bring visitors who convert at higher rates deserve more attention and resources. Equally important, sources with poor conversion performance need landing page or journey optimization.
Creating a customer journey map is the first step. But it’s a critical one. So, take the time to understand GA4 reports really well. A complete tutorial on GA4 explorations will require multiple blog posts.
Common Customer Journey Mapping Pitfalls To Avoid
As you implement your customer journey mapping in GA4, watch out for these common mistakes:
Thinking of Internal Processes Instead of Customer Experience
Approximately 75% of companies approach journey mapping from an internal perspective rather than focusing on the actual customer experience.
Solution: Always start with the customer’s goal, not your business processes. Ask “What is the customer trying to accomplish?” rather than “How do we want to structure this flow?”
Building Reports on Incomplete Data
About 68% of organizations collect data but don’t use it in their mapping processes.
Solution: Use all five GA4 reports outlined above to build a complete picture. Don’t rely on a single report or metric to drive decisions.
Adding Too Many Steps to Your Journey Maps
Simplicity is key to an effective customer journey map. Yet, many businesses fall into the trap of trying to include every possible detail.
Solution: Use the 80/20 rule. Focus on mapping the 20% of journey touchpoints that influence 80% of conversion decisions. That means looking at friction points on the most critical pages, like your pricing page, features page, and product landing pages.
Your GA4 Journey Map to Conversion Gold
Your website visitors aren’t lost; they just missed the route you planned for them.
GA4 gives you the map to guide them toward conversion, showing exactly where they wander off.
So, take small but strategic steps:
- Pick your highest-value conversion goal.
- Map its current journey using GA4’s path exploration and funnel reports.
- Fix the biggest drop-off point first.
- Measure, refine, and repeat!
Each optimization cycle compounds your results without requiring more traffic.
That’s the power of journey mapping. Not working harder to attract visitors with SEO, but working smarter to convert the ones you already have.
Your roadmap is ready. Your tools are waiting in GA4. Make next month your record-breaking conversion month.
Did you enjoy this article?